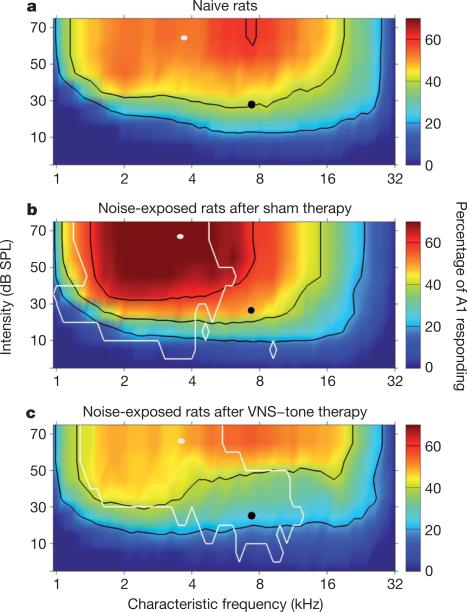
Figure 3. VNS/multiple tone pairing reverses map distortion.
The increased response of A1 neurons to tones following noise exposure is reversed by VNS/multiple tone pairing. a, Colour indicates the percentage of A1 neurons in naive rats that respond to a tone of any frequency and intensity combination. b, Percentage of A1 neurons that respond to each tone in noise-exposed rats that received sham therapy. c, Percentage of A1 neurons that respond to each tone in noise-exposed rats that received the VNS/multiple tone therapy. Black contour linesindicate 20, 40, and 60% responses. The white linesin b surround theregions of tones that are significantly increased (P < 0.01) in comparison with naive rats. The white lines in c indicate significant decreases (P < 0.01) in comparison with noise-exposed sham therapy rats. The filled white circles indicate the tone for which the increase in the number of cortical neurons was greatest, which is used to quantify the degree of map distortion in Fig. 4a, b. The filled black circles indicate the tone for which the proportional increase was greatest.

