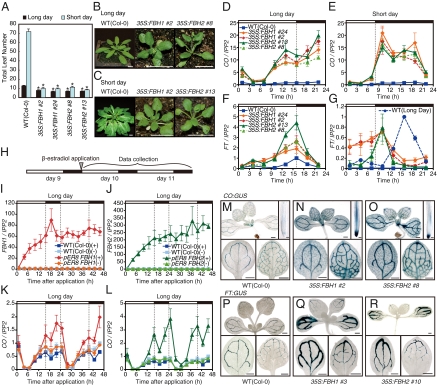
Fig. 2.
FBH1 and FBH2 control CO expression levels. (A) Flowering phenotypes of plants overexpressing FBH1 (35S:FBH1) and FBH2 (35S:FBH2) under different photoperiods. Error bars depict SEM (n = 6). Asterisks (*) denote significant difference (P < 0.001) between each overexpressor and wild-type plants. The experiment was repeated at least twice, and similar results were obtained. (B and C) Representative pictures of 35S:FBH plants in LD (B) and SD (C). The pictures were taken just after the plants bolted. (B) Wild type, 27 d old; 35S:FBH1, 18 d old; and 35S:FBH2, 18 d old in LD. (C) Wild type, 70 d old; 35S:FBH1, 28 d old; and 35S:FBH2, 28 d old in SD. (Scale bars,10 mm.) (D–G) Daily expression patterns of CO (D and E) and FT (F and G) in 35S:FBH1, 35S:FBH2, and wild-type plants in LD and SD. The FT expression pattern of wild type in LD (blue dashed line) was superimposed on SD data (G). All of the results (D–F), except G, were normalized to the highest values in the wild-type sample (the maximum value of wild type was set to 1). FT levels in SD (G) were normalized to the peak FT expression value in the wild type in LD. (H) Seedlings that possess pER8-FBH1 or pER8-FBH2 constructs were treated with β-estradiol at day 10 at the onset of light (ZT 0). The arrowhead indicates the start time point of β-estradiol application. Seedlings were harvested starting at 1 h after the onset of light (ZT 1) and then at 3-h intervals for 2 d. (I–L) FBH1, FBH2, and CO mRNA expression in wild-type plants and pER8-FBH1 and pER8-FBH2 transgenic plants after β-estradiol application. The samples treated with and without β-estradiol are indicated by (+) and (−) symbols, respectively. FBH1 and FBH2 levels were normalized to the average value in the wild-type (−) sample [the average value from all of the wild-type (−) time points was set to 1]. The CO level was normalized to the maximum value of the wild-type (−) sample [the maximum value of wild type (−) was set to 1]. Values represent means ± SEM from three biological replicates in D–G and in I–L. The bars above the graphs represent light conditions: white bars, light periods; black bars, dark periods. (M–R) Spatial expression patterns of CO and FT gene in 35S:FBH plants. Twelve-day-old wild-type (M), 35S:FBH1 (N), and 35S:FBH2 (O) plants carrying the CO:GUS reporter gene and wild-type (P), 35S:FBH1 (Q), and 35S:FBH2 (R) plants carrying the FT:GUS reporter gene were analyzed. Whole-mount staining of seedlings, cotyledons, and the first set of leaves are shown with scale bars (0.5 mm). Staining of root tips is shown with scale bars (0.1 mm).

