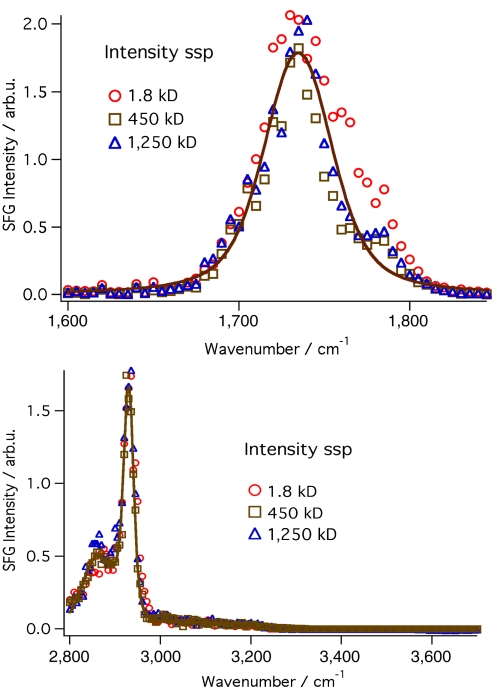
Fig. 2.
VSF spectra of PAA in the carbonyl (upper) and water/CH region(lower) for three different molecular weights (1.8, 450, 1,250 kD) of the polymer. Each of the three molecular weights is observed to overlap with the others, indicating the same amount of surface coverage and orientation for each. The max intensity is representative of what is observed within one minute of setting up the oil–PAA(aq) interface.

