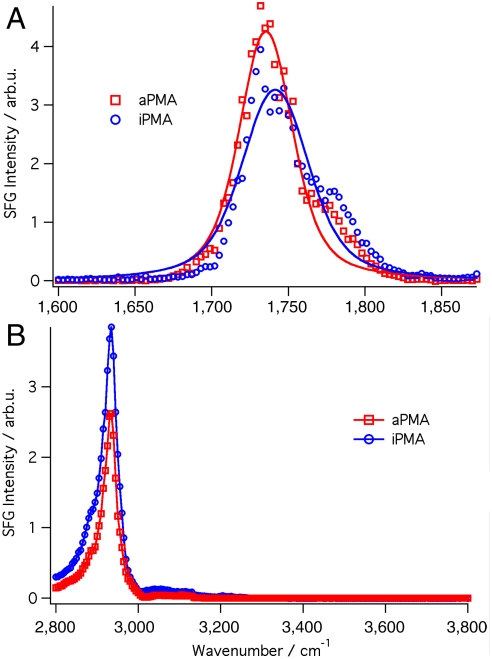
Fig. 4.
VSF spectra of PMA in the atactic form (5 ppm, 31.1 kD, red) and reprotonated isotactic form (5 ppm, 3 kD, blue) isomers at pH 1.5. (A) VSF spectra of the carbonyl region centered at 1,740 cm-1 for iPMA and 1,735 cm-1 for aPMA. The solid line is a representative fit of the data. (B) VSF spectra of the water and CH region. The dashed line is a guide for the eye.

