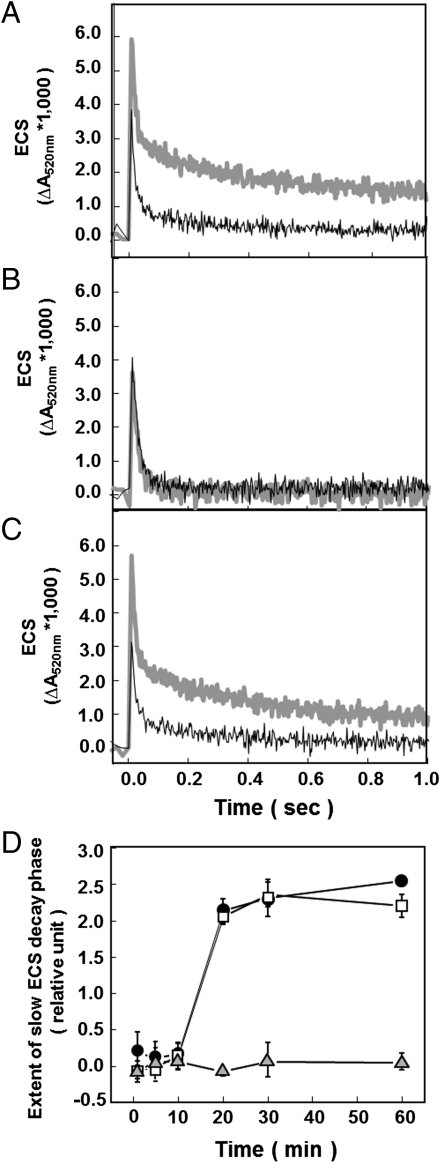
Fig. 2.
Redox state of the ATP synthase probed by the decay of flash-induced ECS signals. Flash-induced relaxation kinetics of ECS were measured in wild type (A), gamera (B), and atpc2 (C) at 1 (thin black line) and 60 min (thick gray line) dark adaptation following after 2 min preillumination at 100 μmol photons m-2 s-1 red actinic light. The extent of slow ECS decay phase of ECS kinetics after brief subsaturating actinic illumination in wild type (black circles), atpc2 (open squares), and gamera (gray triangles) (D). Data is for attached leaves with n = 3.

