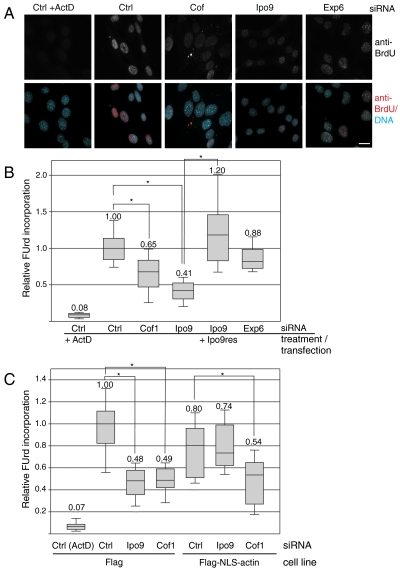
Fig. 6.
Active nuclear transport of actin supports transcription. (A) Immunofluorescence images of mammalian cells transfected with siRNAs and treated with actinomycin D (ActD) as indicated. 5 FUrd incorporation was used as a measure of transcription and detected with anti-BrdU (Upper). Lower shows a merged image of anti-BrdU (red), and DAPI (cyan). Scale bar = 10 μm (B) Quantification of BrdU signal is shown as box-and-whisker plots with median and 5th/95th percentile for NIH 3T3 cells treated with indicated siRNAs. When indicated the cells were treated with ActD or were expressing the Ipo9 siRNA resistant construct (Ipo9res). Data were normalized to control siRNA. (C) Quantification of BrdU signal shown in box-and-whisker plot for cell lines expressing either the empty vector (Flag) or Flag-NLS-actin, and treated with the indicated siRNAs (more than 20 cells were quantified per treatment), and data were normalized to control siRNA in the Flag-cell line. Median value is indicated on top of the whisker and the asterisks indicate P ≤ 0.001.

