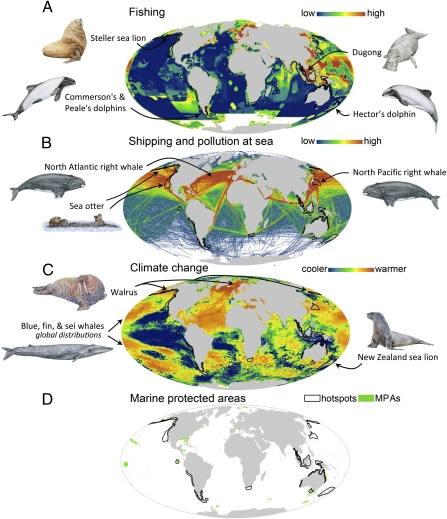
Fig. 4.
Global hotspots of marine mammal species extinction risk, overlaid with the geographic distributions of the leading human impacts (1) on marine mammals and with Marine Protected Areas (MPAs) (39). (A) Fishing intensity. (B) Ship traffic and pollution. (C) Sea-surface temperature change: 1985–2005. (D) World distribution of MPAs (see also Fig. S6 for magnified view of D). Hotspots show the top 2% of geographic grid cells for at-risk species (model-predicted plus IUCN Red List species). Maps A, B, and C show examples of species predicted to be at risk by our model that occur within the hotspots, or other highly impacted regions, and whose populations are threatened by fishing, shipping, pollution, or climate change. Drawings are by Sharyn N. Davidson.

