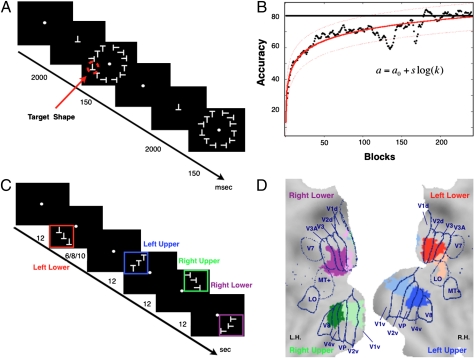
Fig. 1.
Behavioral training, psychophysics results, visuotopic localizer, and ROIs. (A) Experimental paradigm. (B) x axis, number of blocks; y axis, accuracy (i.e., percentage of correct response corrected for percentage of false alarms). Black dots display the group average performance block by block; solid red line indicates the psychophysical fitting model a = a0 + slog(k) with prediction bounds at 95% of confidence level (dotted lines). (C) Design of visuotopic localizer. Squares of different colors (not shown in real display) indicate a visual quadrant. (D) Visual ROIs/seeds. Eight visual regions (seeds) defined on the basis of the visuotopic localizer scan are displayed on the flattened representation of posterior occipital cortex using the PALS atlas (29). Blue lines are approximate borders between retinotopic visual areas based on a standard atlas (29) L.H., left hemisphere; R.H., right hemisphere.

