Fig. 3.
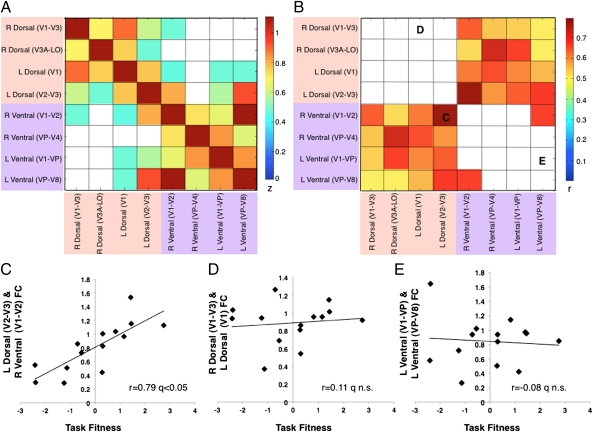
Task fitness and pretraining FC within visual cortex. (A) Correlation matrix (Fisher Z-transformed Pearson coefficient) of all ROI pairs in visual cortex. Yellow/orange color indicates positive correlations, white color indicates nonsignificant correlations (permutation test on the entire correlation matrix; FDR q < 0.05). Dorsal visual regions are highlighted by light pink, ventral visual regions by light purple. (B) Correlation matrix (Pearson coefficient r) of PC1 and FC between all possible ROI pairs in visual cortex. Red/yellow cells indicate positive FC–PC1 correlations, white cells indicate nonsignificant correlations (permutation test on the entire correlation matrix; FDR q < 0.05). (C–E) x axis, task fitness, i.e., principal component scores of PC1; y axis, FC (Fisher Z-transformed) between two heterotopic (C), homotopic (D), and neighboring (E) visual regions. Each diamond represents an observer. For Pearson correlation coefficient, permutation test was performed on the entire correlation matrix (FDR q < 0.05).

