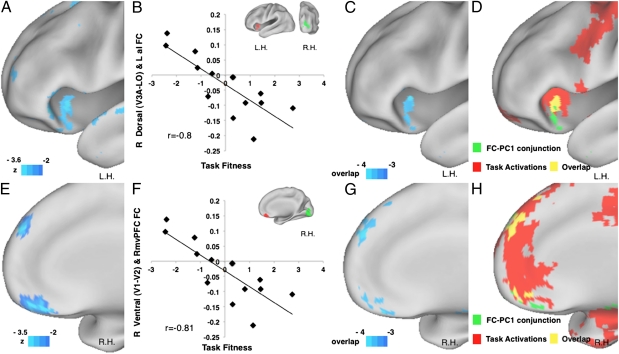
Fig. 4.
Task fitness and pretraining FC to/from visual cortex and frontal regions. (A) Lateral view of the voxel-wise FC–PC1 correlation map starting from a right dorsal visual seed (V3A–LO), corresponding to the left lower visual quadrant. Color scale is the same as in Fig. 2. L.H., left hemisphere. (B) x axis, task fitness; y axis, FC (Fisher Z-transformed) between a right dorsal visual seed V3A–LO (green, Inset; same as in A) and left anterior insula (LaI; red) extracted from the FC–PC1 correlation map in A (Talairach coordinates, −38 +18 −07; 171 voxels). Each diamond represents an observer. (C) Conjunction map of FC–PC1 correlation maps from eight visual seeds. Color scale is the same as in Fig. 2. (D) Conjunction map between activation map of orientation discrimination task (trained plus untrained shape greater than fixation, Z-statistic >3, P < 0.05, Monte Carlo corrected; Methods) and FC–PC1 conjunction map thresholded at negative three of eight (green). Overlapped voxels are in yellow. (E) Medial view of the voxel-wise FC–PC1 correlation map starting from a right ventral visual seed (V1–V2), corresponding to the left upper visual quadrant. Color scale is the same as in A. R.H., right hemisphere. (F) x axis as in B; y axis is FC (Fisher Z-transformed) between a right ventral visual seed V1–V2 (green, Inset) and a right ventral medial prefrontal cortex (RvmPFC; red) extracted from the FC–PC1 correlation map in A (Talairach coordinates, +04 +38 −18; 120 voxels). Each diamond represents an observer. (G) Medial view of the same conjunction map in B, with the same color scale. (H) Conjunction map between deactivation map of orientation discrimination task (trained plus untrained shape less than fixation, Z-statistic > 3, P < 0.05, Monte Carlo corrected; Methods) and FC–PC1 conjunction map thresholded negative three of eight (green). Overlapped voxels are in yellow.

