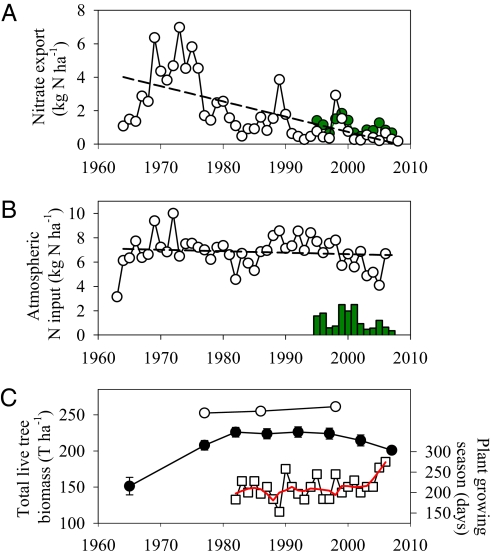
Fig. 1.
Historic N loads and forest dynamics at HBEF. (A) Annual hydrological export of nitrate (1964–2008; n = 45) and DON (since 1995; n = 13) from watershed 6 (W6; white and green circles, respectively). The linear trend of nitrate across years is shown with a dashed line (r2 = 0.38, slope ± SE = −0.08 ± 0.02 kg N ha−1 y−1, P < 0.001). Nitrate export declined from an average (± SE) of 5.13 ± 0.39 kg N ha−1 y−1 during the 1969–1976 high nitrate reference period to 0.42 ± 0.07 kg N ha−1 y−1 in 2000–2007. We quantified the nitrate decline (missing nitrate in the text) between 1977 and 2007 by subtracting the annual nitrate export observed each year from the average value of the high nitrate reference period (5.13 kg N ha−1 y−1; 1969–1976); this decline in export was equivalent to 125 ± 12 kg N ha−1 over 30 y. Similar quantities result from alternative calculations based on the trend in nitrate export determined from either linear or curvilinear fits to the long-term record (1969–2007). DON export showed no linear trend over time (P > 0.05). (B) Annual bulk deposition of inorganic N (nitrate + ammonium) in W6 (1964–2008; n = 45) did not display any significant linear trend over time (dashed line; P > 0.05). There was no significant linear trend in DON deposition since 1995 (green bars; n = 13, P > 0.05). (C) Total live tree biomass [≥10 cm diameter at breast height (DBH)] in W6 (1965–2007; n = 8) and the Bird Area (1981–2001; n = 3; black and white circles, respectively; error bars are as in ref. 14; error bars in the Bird Area are smaller than symbols). Length of the growing season from 1982 to 2006 is shown by squares (n = 25); locally weighted scatterplot smoothing is in red. Although there was no significant linear trend before 2002 (P > 0.05), the long-term trend became significantly positive after 2002 (r2 = 0.89, slope = 19.7 ± 4 d y−1, P < 0.02).

