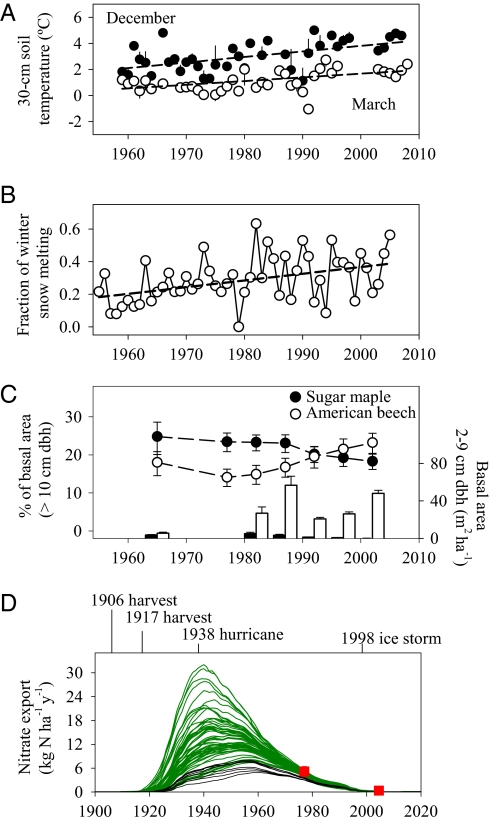
Fig. 3.
Historic soil temperature and hydrological data, changes in forest species composition, and simulated long-term trend of nitrate export with the LM3V model. (A) Mean (error bars are ± SE) soil temperature at 30-cm depth in December and March (1959–2007). The linear fit (dashed lines) was significant in both cases (P < 0.001; December: r2 = 0.28, slope = 0.046 ± 0.011 °C y−1, n = 39; March: r2 = 0.27, slope = 0.028 ± 0.007 °C y−1, n = 38). There was no significant trend in late spring and summer (P > 0.05 for April to September). (B) Fraction of intermittent warming events that caused winter snowmelt (1955–2007). The dashed line is the linear fit (r2 = 0.18, slope = 0.004 ± 0.001 y−1, P < 0.01, n = 51 y). (C) Relative contribution to the total basal area (≥10 cm DBH; circles, n = 7) and basal area for the saplings (2–9 cm DBH; bars, n = 6) of sugar maple and American beech in the mid- and low-elevation areas in the W6 forest (1965–2002). Error bars are 95% confidence intervals of the mean are based on plot-scale variation. (D) Nitrate export at HBEF simulated with the LM3V model. The lines represent a subset of 500 simulations, where different intensities of tree mortality have been prescribed (SI Results and Discussion). Red squares are volume weighted average nitrate export for the high N export period (1969–1976) and the low N export period (2000–2007) measured at HBEF. Green lines represent simulations that reproduce peak nitrate export as observed during the high N period. The range in tree mortality for this subset of runs was 0–55% and 45–95% for the 1906 and 1917 events, respectively (SI Results and Discussion) Black lines denote simulations with tree mortality from the literature (24) (20% ± 10% and 60% ± 10% for the 1906 and 1917 events, respectively). In all cases, tree mortality was set to 20% and 30% for the 1938 hurricane and the 1998 ice storm (25, 26).

