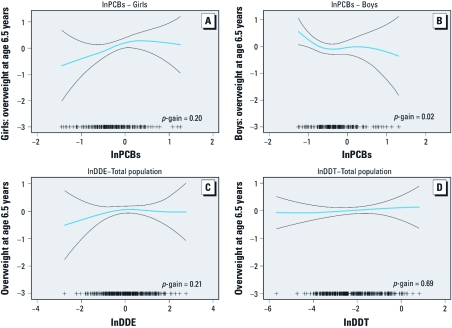
Figure 1.
Generalized additive models of the adjustedª associations of prenatal lnPCBb for girls (n = 178) (A) and boys (n = 166) (B), and lnDDE(n = 343)c (C) and lnDDT (n = 344) (D) concentrationsd (nanograms per milliliter) with overweight at 6.5 years. Abbreviations: ++, number of observations; p-gain, difference in fit between GAM and linear models. Blue line is the smoothed function for (ln)OCs and black lines are the 95% CIs. ªAdjusted for birth weight, previous parity, maternal prepregnancy BMI, maternal education and social class at pregnancy, maternal smoking in pregnancy, maternal age at delivery, and breast-feeding. bPresented separately in girls and boys because of statistically significant sex interaction. cOne influential outlier excluded: the observation with the highest DDE exposure (lnDDE = 2.97 ng/mL). dLog-transformed because distributions were skewed to the right.

