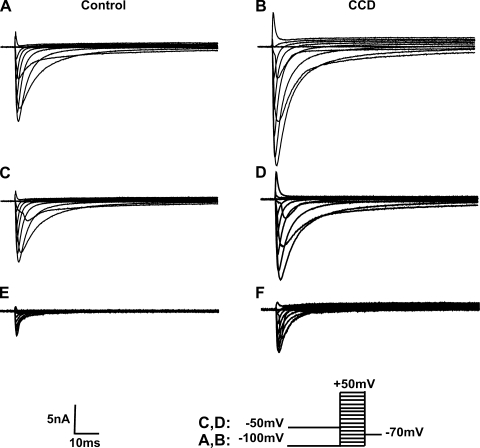
Fig. 2.
Representative waveforms of voltage-gated Na+ currents for a control neuron and a CCD neuron. A and B: total Na+ current. Traces were recorded in response to a series of 80-ms test pulses in 10-mV increments from −100 to 50 mV preceded by a 500-ms prepulse of −100 mV. C and D: TTX-resistant (TTX-R) currents were recorded in response to the same series of command potentials pulses but preceded by a 500-ms prepulse of −50 mV. E and F: TTX-sensitive (TTX-S) currents obtained by subtraction of TTX-R currents from the total Na+ current.

