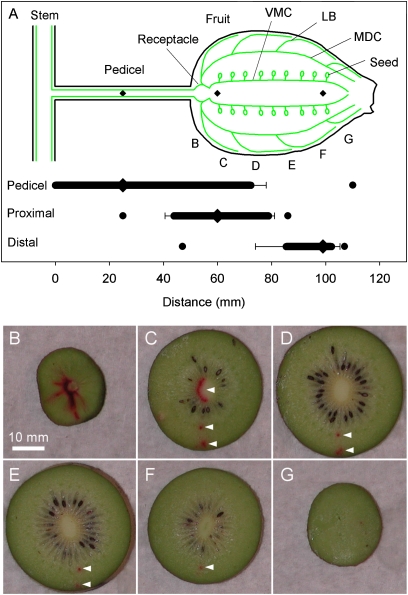
Fig. 3.
(A) Diagram showing the median longitudinal arrangement of the major vascular bundles of an Actinidia berry (after Hopping, 1990), and the distances travelled in both directions by the apoplasmic dye Safranin O introduced into the xylem of Actinidia chinensis ‘Hort16A’ fruit using wicks (horizontal bars). (B–G) Slices of a fruit showing an example of dye transport from the pedicel into the fruit. The wick method labels bundles intercepted by the secant traversed by the wick (see the Materials and methods for an explanation). In this example, dye has passed through the receptacle area and entered ventromedian carpellary (VMC), median dorsal carpellary (MDC), and lateral branch bundles (LB) (arrowheads), and travelled to the distal end of the fruit in one MDC bundle. In A, letters indicate the approximate position of transverse slices shown in B–G, and the horizontal bars indicate the mean distance travelled (error bars=1 SE) in the basipetal and acropetal directions from three points of loading (pedicel, proximal, and distal, diamonds); circles represent the maximum distance travelled in both directions. Data from individual fruit were normalized to a fruit 70 mm long with a 50 mm pedicel. n=6–12 fruit for each loading position.

