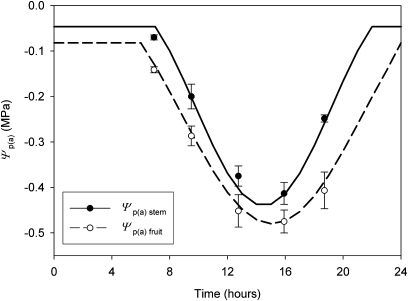
Fig. 4.
Apoplasmic pressure potentials of Actinidia chinensis ‘Hort16A’ fruit [Ψp(a) fruit] and the stem at the point of attachment of the fruit [Ψp(a) stem] over the course of a day in California, 192 DAA. Lines represent sinusoidal curves fitted to the data for the purpose of modelling the fruit water balance (see the Materials and methods). n=6 for each point, ±1 SE.

