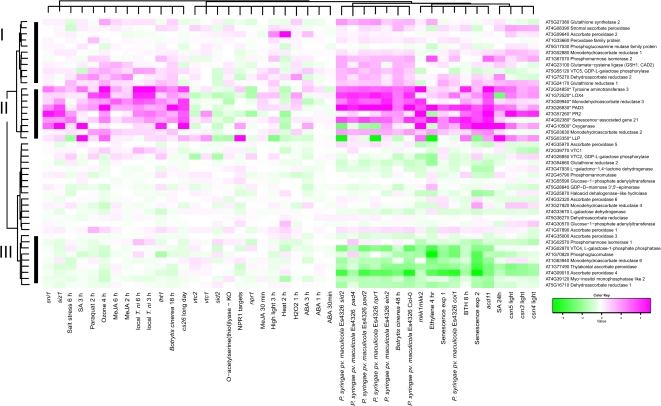
Fig. 6.
Expression of ascorbate–glutathione cycle, ascorbic acid, and glutathione biosynthesis genes during abiotic and biotic stress, during hormone treatments, and in constitutive defence mutants. Bootstrapped Bayesian hierarchical clustering of genes is shown in plants subjected to stress treatments compared with normal growth conditions, or in mutant versus wild type. Magenta and green indicate increased and decreased expression compared with untreated or wild-type plants, respectively.

