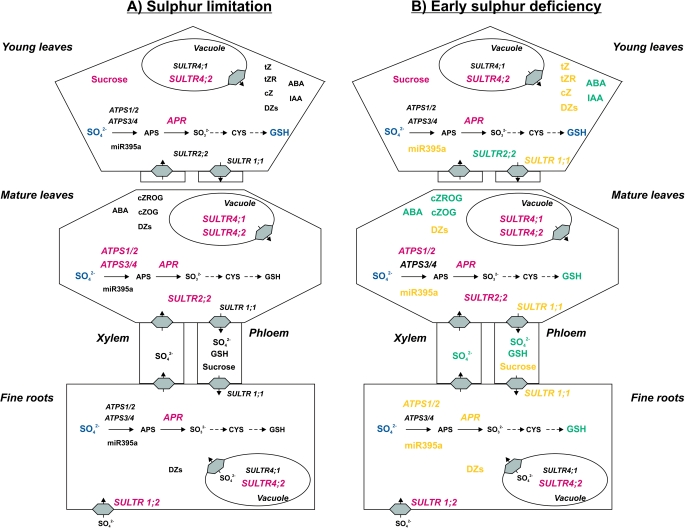
Fig. 11.
Schematic overview of the changes in sulphur metabolism of poplar during sulphur limitation (A) and during early sulphur deficiency (B). Changes in expression of sulphur-metabolism related genes, metabolite or plant hormone contents during sulphur limitation are labelled in red (increase) or blue (decrease). Additional changes appearing first during early sulphur deficiency are marked in yellow (increase) or blue green (decrease). ABA, abscisic acid; APS, adenosine 5′-phosphosulphate; CYS, cysteine; cZ, cis-zeatin; cZOG, cZ O-β-glucoside; cZROG, cZ riboside O-β-glucoside; DZs, dihydrozeatins; GSH, glutathione; IAA, indole-3-acetic-acid; tZ, trans-zeatin; tZR, tZ riboside. For abbreviations of genes (in italics) see text.

