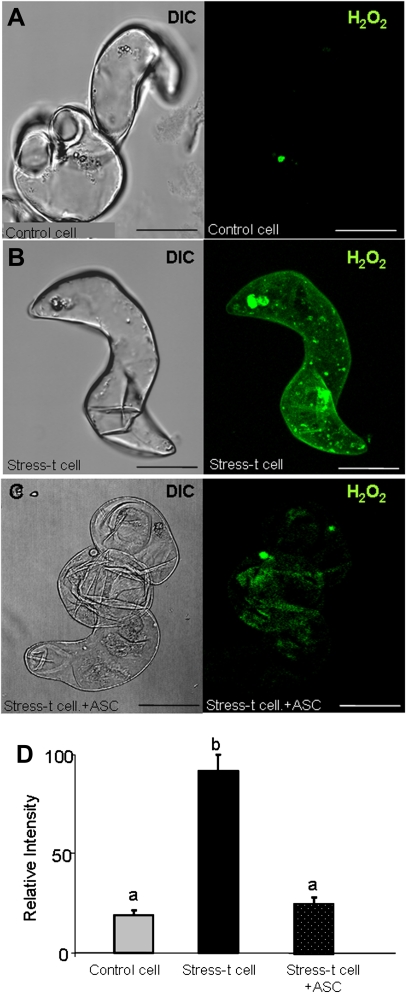
Fig. 13.
Imaging of H2O2 production in barley embryogenic suspension cultures with a 2′,7′-dichlorofluorescein diacetate (DCF-DA)-specific probe and confocal analysis. (A–C) Micrographs showing the differential interference contrast microscopy (DIC) image and the H2O2-dependent DCF-DA fluorescence in red (maximum projection of several optical sections): (A) control cells; (B) H2O2 production in stress-treated cells. (C) negative control: stress-treated cells incubated with ascorbate (ASC, H2O2 scavenger); bars, 45 μm. (D) Histogram showing relative fluorescence intensities reflecting differences between treatments. Stress-t cell, stress-treated cells. Letters indicate significant difference at P < 0.001 according to Duncan’s multiple-range test. (This figure is available in colour at JXB online.)

