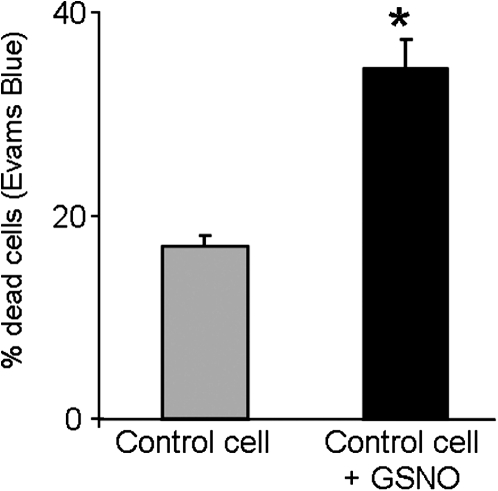
Fig. 15.
Quantification of cell death induced by exogenous NO in barley embryogenic suspension cultures. Histogram showing the percentage of dead cells detected by Evans Blue staining in control suspension cell cultures (control cell) and suspension cultures treated with the NO donor GSNO for 2 days. Asterisk indicates significant difference at P < 0.05 according to Duncan’s multiple-range test.

