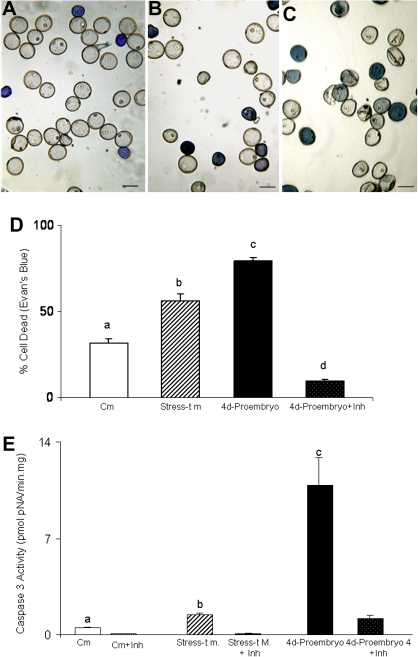
Fig. 5.
Cell death and caspase 3-like activity in barley microspore cultures. (A–C) Evans Blue staining revealing dead microspores as blue cells: (A) control microspores, before the stress treatment; (B) stress-treated microspores; (C) microspore culture 4 days after stress; bars, 20 μm. (D) Histogram showing the percentage of dead cells identified by Evans Blue staining, in control microspores (Cm) and the three stages illustrated in the micrographs. (E) Caspase 3-like activity in the three stages, with the caspase 3 inhibitors (+Inh) as negative controls. Stress-t m, stress-treated microspores. Letters indicate significant differences at P < 0.05 according to Duncan’s multiple-range test. (This figure is available in colour at JXB online.)

