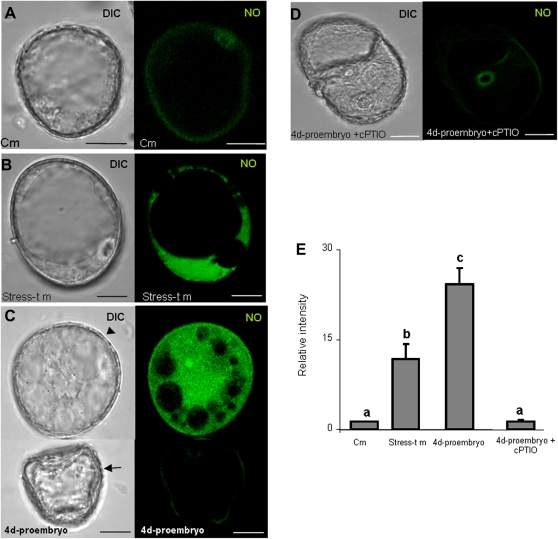
Fig. 7.
Imaging of NO production in barley microspore cultures with 4,5-diaminoflorescein diacetate (DAF-2DA)-specific probe and confocal analysis. (A–D) Micrographs showing the differential interference contrast microscopy (DIC) image and the NO-dependent DAF-2DA fluorescence in green (maximum projection of several optical sections): (A) control microspore with no signal for NO; (B) stress-treated microspore with a rounded shape and big size corresponding to an embryogenic microspore, showing NO fluorescence signal in cytoplasm, the large vacuole appears negative; (C) microspores after 4 days in culture: in the upper image a bigger rounded cell, typically a 4-day embryogenic microspore or pro-embryo (arrowhead), with high NO signal; in the lower image, a smaller cell with contracted cytoplasm, typically a non-embryogenic cell (arrow), showing no NO fluorescence; (D) negative control in 4-day-pro-embryo after incubation with cPTIO, NO scavenger; bars, 15 μm; (E) histogram showing the relative fluorescence intensities for the control (Cm) and the three stages illustrated in the micrographs. Stress-t m, stress-treated microspores. Letters indicate significant differences at P < 0.05 according to Duncan’s multiple-range test.

