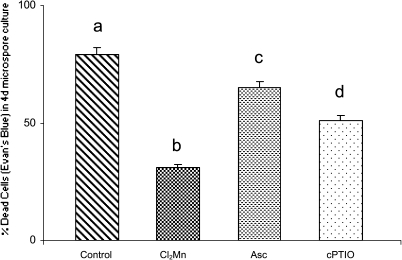
Fig. 8.
Effect of treatments with ROS and NO scavengers on stress-induced cell death in microspore cultures. Histogram indicating the percentage of dead cells, detected by Evans Blue, in microspore cultures 4 days after the stress treatment, without scavengers (control) or with treatments with Cl2Mn (O2.− scavenger), ascorbate (Asc, H2O2 scavenger), or cPTIO (NO scavenger). Different letters indicate significant differences at P < 0.05 according to Duncan’s multiple-range test.

