Fig. 9.
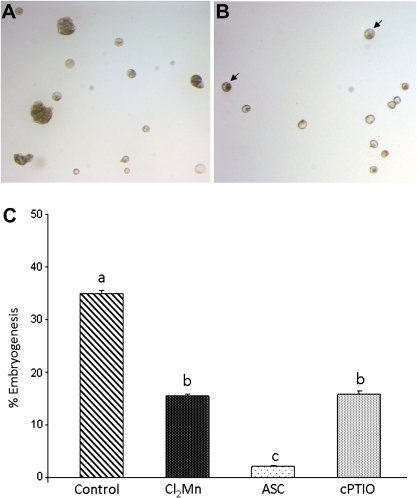
Effect of treatments with ROS and NO scavengers on the percentage of microspore embryogenesis. (A) Control microspore culture at 20 days after the inductor stress treatment, micrograph showing large developing embryos (arrowheads), dense and large multicellular microspores (arrows), and small non-embryogenic microspores; bar, 50 μm. (B) Microspore culture treated with the NO scavenger, cPTIO, for 20 days after the inductor stress treatment, exhibiting some dense and large multicellular microspores (arrow) and many small non-embryogenic microspores; bar, 50 μm. (C) Histogram indicating the percentage of embryogenic structures (large embryos and multicellular microspores) in microspore cultures 20 days after the inductor stress treatment, without scavengers (control) or with treatments with Cl2Mn (O2.− scavenger), ascorbate (Asc, H2O2 scavenger), or cPTIO (NO scavenger). Different letters indicate significant differences at P < 0.05 according to Duncan’s multiple-range test. (This figure is available in colour at JXB online.)

