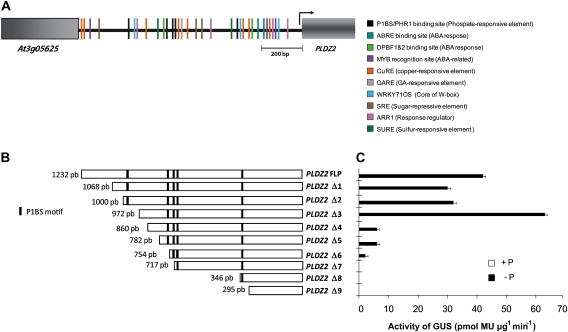
Fig. 1.
Deletion analysis of the PLDZ2 promoter. (A) Structure of the 1,232 bp PLDZ2 promoter showing potential transcription binding DNA motifs. (B) PLDZ2 full-length promoter and end-points of progressive promoter deletions. Promoter lengths are indicated with respect to the start codon. Positions of putative P1BS elements are shown as black vertical lines. (C) GUS specific activity determined by fluorometric assays for a representative line of each promoter deletion construct. Values indicate the mean activity obtained from four independent replicate reactions. SD for each value is shown. (This figure is available in colour at JXB online.)

