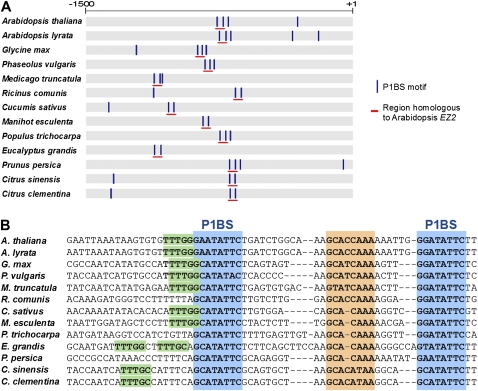
Fig. 9.
Sequence comparison of the PLDZ2 promoter with orthologous promoter regions. (A) Schematic representation of the promoter region of orthologues for PLDZ2 showing the location of the P1BS motifs (vertical lines) and the region corresponding to the EZ2 element (horizontal lines). Scale represents location in bp relative to the start codon. (B) Sequence comparison of the EZ2 element with similar regions found in orthologous promoter sequences. P1BS motif and other conserved sequences are shaded. Gaps (–) were included for clarity of the alignment. (This figure is available in colour at JXB online.)

