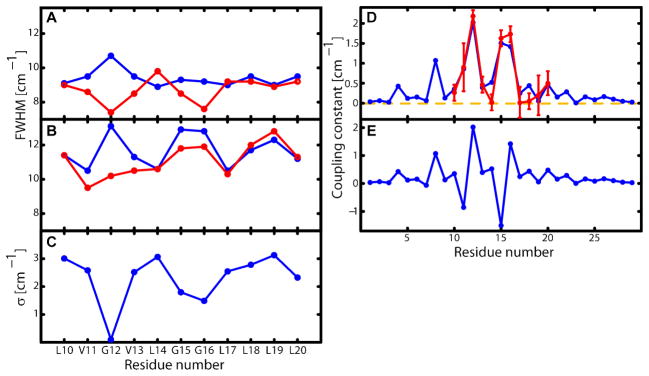
Fig. 3. Residue dependance of the spectral widths.
Full width at half maximum (FWHM) of (A) the diagonal trace of 2D IR spectra and (B) the FTIR spectra for the undiluted 100% (blue) and 10% (red) 13C=18O labeled samples. The FWHM versus residue variation exhibits a ca. 3.6 residue repeat corresponding to the helicity of the monomers. The 2D IR traces of the 10% samples show a change in phase in this oscillation resulting from the higher homogenous component of the residues facing the inside of the dimer (see SOM for discussion of this point). The overall smaller widths of the 2D IR traces compared to the FTIR spectra make the determination of the coupling constant more accurate. (C) The inhomogeneous component σ defining the Gaussian average. It is obtained by varying σ2, and the zero order frequencies (see SOM) in fits of the FTIR and 2D IR traces to the model explained in the text. This result is consistent with the noticeable elongation of the peaks of the 2D IR spectra and it suggests that the residues involved in the tertiary contact experience a narrower distribution of structures. (D) The absolute value of the coupling constants for the final structure (red) and those obtained from the fit of the experiment (blue). also present a periodicity of ca. 3.6 residues. G12, G15 and G16 form the tertiary contact and present the highest coupling magnitudes. The error bar corresponds to a change in χ2 of 0.5(E) The signed coupling constant of the final structure. G15, L19 and V11 have negative coupling constants.

