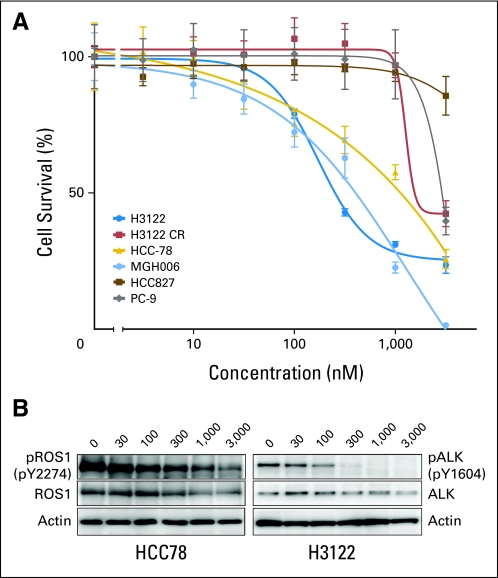
Fig 2.
(A) Dose-response cell survival curves of ROS1-rearranged cell line (HCC78) and ROS1-negative cell lines in response to crizotinib (nM); ALK-positive lines H3122 and MGH006 are positive controls for crizotinib response, and the PC-9, HCC827, and crizotinib-resistant H3122 CR lines are negative controls. (B) Western blot reveals a three-fold reduction of phospho-ROS1 in HCC78 cells at the same concentration (300 nmol/L) of crizotinib that results in near-complete reduction of phospho-ALK in H3122 cells. Total ROS1 and ALK, as well as actin, are shown as controls. The concentration of crizotinib is indicated above each lane (in nM).

