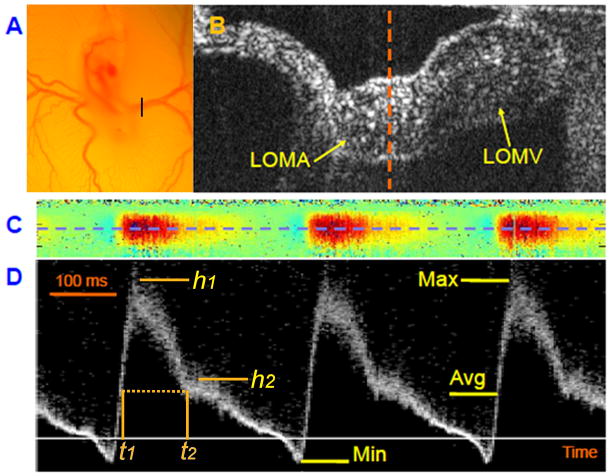
Figure 2.
Doppler OCT can provide high resolution pulsed Doppler waveforms at the position of the vitelline artery for hemodynamic measurements. (1A), Microscopic view of a stage 17 quail embryo connected to the extraembryonic vasculature spreading over the yolk in an ex ovo shell-less culture. The black bar indicates the location of the vitelline vessels that was scanned for OCT imaging. (1B). B-scan OCT image of the vitelline vessel. LOMA - left omphalomesenteric artery; LOMV - left omphalomesenteric vein. (1C). Colored Doppler image at the midline of LOMA (dashed line in Figure 1B). The red color indicates forward blood flow, and the blue color indicates retrograde blood flow. (1D). Pulsed Doppler images at the center of LOMA (blue dashed line in Figure 1C). The magnitude of the signal indicates relative flow velocity with positive values representing forward blood flows. Max – maximal flow, Min – minimal flow (or maximal retrograde flow), and Avg – timed-average flow.

