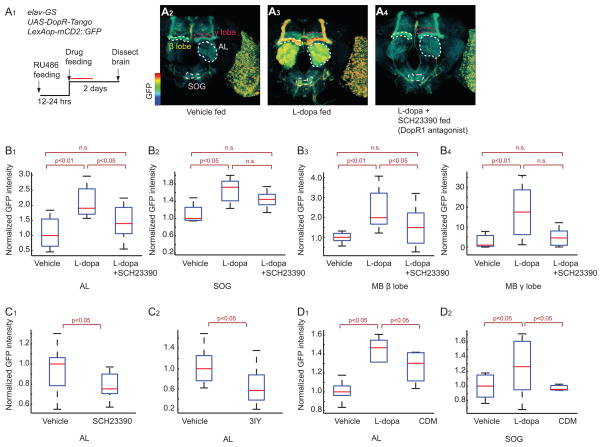
Figure 2. Characterization of DopR-Tango in transgenic flies.
(A). Specific activation of DopR-Tango by L-dopa in vivo. (A1) experimental design. Red line represents 24 hr detection window for Tango reporter (see Figure S1E and supplemental footnote 1). (A2–4) pseudocolor images of DopR-Tango reporter (GFP) expression; color scale to left. See Figure S2 for image processing details. Neuropils indicated by dashed outlines are: AL, Antennal Lobe (white); SOG, suboesophageal ganglion (pink); mushroom body (MB) β and γ lobes (yellow and red, respectively). (B–D). Quantification of reporter expression in the indicated neuropils. SCH23390, D1 receptor antagonist; 3IY (3-iodotyrosine, DA synthesis inhibitor). Unless otherwise indicated, p values in this and subsequent figures represent Kruskal-Wallis one-way ANOVA followed by Mann-Whitney U-tests with Bonferroni correction. n>5 for each experimental group. Boxplots: lower and upper whiskers represent 1.5 interquartile-range (IQR) of the lower and upper quartiles, respectively; boxes indicate lower quartile, median and upper quartile, from bottom to top.

