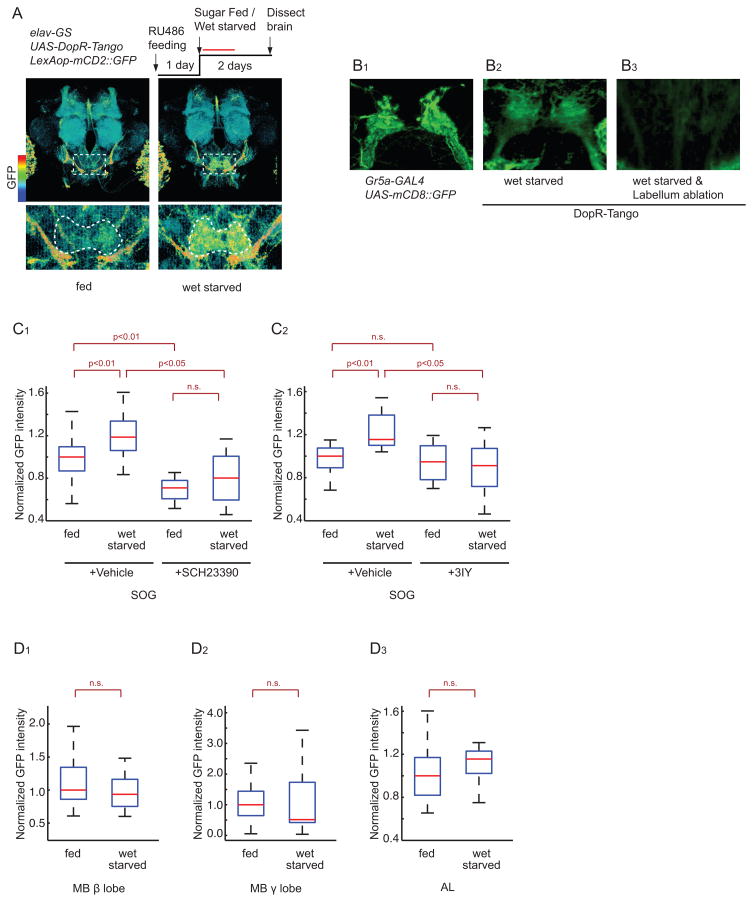
Figure 3. DA release onto GRNs increases during starvation.
(A) Experimental design and normalized Tango reporter (GFP) expression in brains of fed vs. 48-hr wet-starved flies; color scale to left. Laser scanning was performed at a higher gain setting to increase sensitivity. Dashed boxes delineate SOG (enlarged in lower panels). White dashed line in lower panels show ROIs used for quantification, based on UAS-DsRed expression in SOG neuropil.
(B) Representative confocal projections of sugar-sensing GRNs (B1), and Tango reporter expression (B2, B3) in the SOG of normal (B1, B2) or labellum-ablated (B3) flies.
(C, D) Normalized GFP expression in DopR-Tango flies quantified in the SOG (C1–2), MB β lobe (D1), MB γ lobe (D2) and AL (D3). n >6 for each experimental group.

