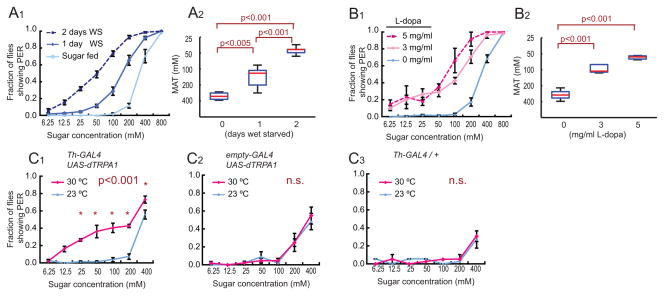
Figure 4. Hunger and DA increase the sugar sensitivity of the PER.
(A) Fraction of fed vs. wet-starved (WS) flies showing a PER at different concentrations of sucrose. (A1). Average responses. Error bars represent S.E.M. (A2) MAT (mean acceptance threshold; the sugar concentration where 50% of the flies show PER), plotted as a function of starvation time. One-way ANOVA followed by t-test with Bonferroni correction (n>4 for each experimental group).
(B) PER responses in non-starved flies fed with the indicated concentrations of L-dopa (n>4 for each experimental group).
(C) Genetic activation of DA neurons increases sugar sensitivity. PER vs. sugar concentration curves are shown for experimental Th-GAL4;UAS-dTRPA1 (C1) and genetic control flies (C2 and C3) at the permissive (red) and non-permissive (blue) temperatures for dTRPA1. Within-genotype differences between temperatures were analyzed using a two-way ANOVA with replication followed by post-hoc t-tests with the Bonferroni correction at each sugar concentration. *; p<0.05, n.s.; not significant (n>4 for each experimental group).

