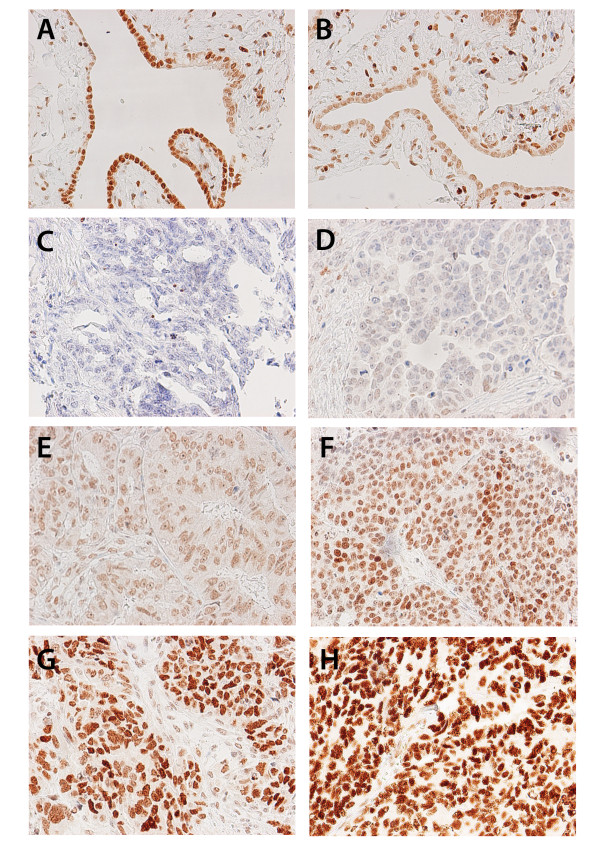
Figure 2.
Immunohistochemical images of DACH2 staining in fallopian tubes and ovarian cancer. Images (20× magnification) representing immunohistochemical expression of DACH2 in (A, B) fallopian tubes, and EOC ranging from (C) negative, (D) weak intensity in few cells, (E) weak intensity in majority of cells, (F) moderate to strong intensity in majority of cells, (G) strong intensity in majority of cells and (H) strong intensity in all tumour cells.

