Figure 4.
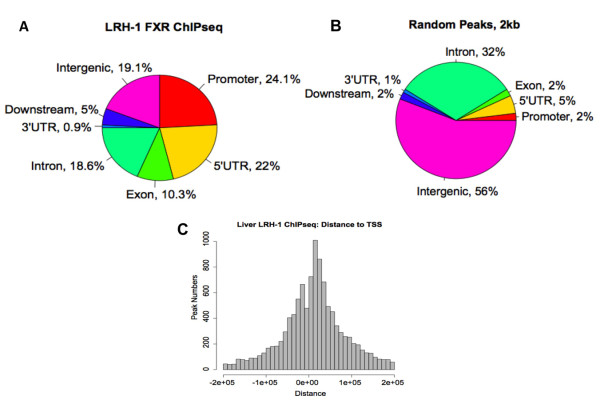
Mapping of LRH-1 binding regions. (A) Mapping of LRH-1 binding peaks on genome-wide scale relative to RefSeq mouse genes. (B) Mapping for random peaks. The 'promoter' and 'downstream' are defined as 2 KB of 5' or 3' flanking regions. Intergenic region refers to all locations other than 'promoter', '5' UTR', 'exon', 'intron', '3'UTR', or 'downstream' (C) Distance from the summit of each LRH-1 peak to the TSS of the nearest RefSeq gene. An arbitrarily located site of the same length in each peak showed a non-enriched distribution pattern as reported previously [27].

