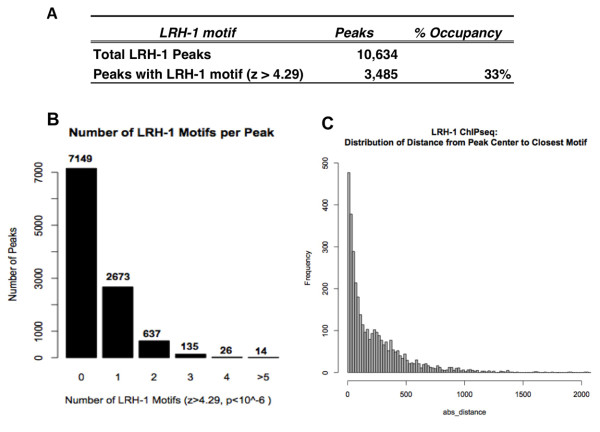
Figure 6.
Motif analysis for LRH-1 binding peaks. (A) Summary of LRH-1 motif analysis. (B) Number of LRH-1 motif in a peak identified by SOLiD ChIP-seq (z > 4.29). (C) Distribution of the distance from the best LRH-1 motif to the summit of each peak with a LRH-1 site. An arbitrarily located site of the same length in each peak showed a non-enriched distribution pattern as reported previously [27].

