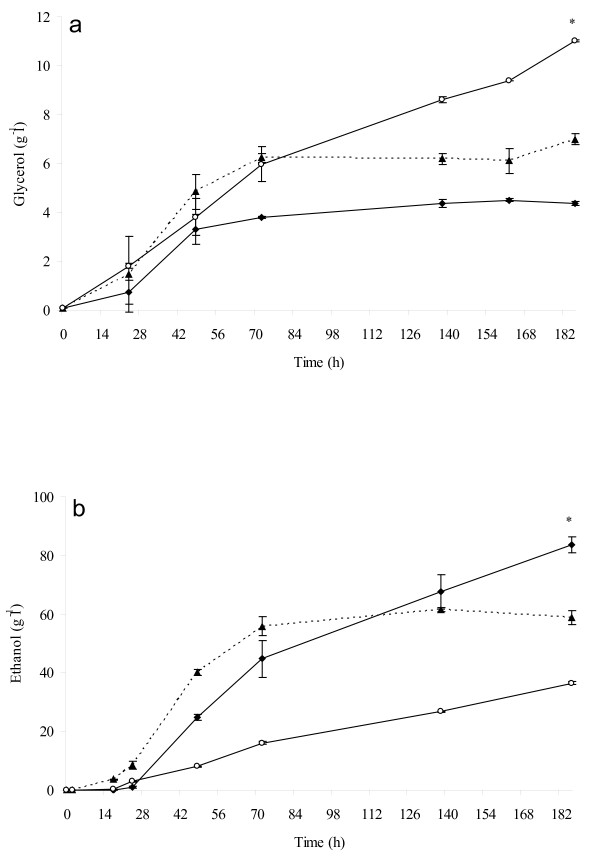
Figure 3.
Glycerol and ethanol production. Evolution of glycerol (a) and ethanol (b) during fermentation carried out by mixed culture (▲ dashed lines), pure S. cerevisiae culture (♦ continuous line) and immobilized S. bombicola pure culture (○ continuous lines). The data represented are the mean of three technical repetitions for two independent biological samples ± SD. Asterisk represents significantly different values according to the Duncan test (0.05%).

