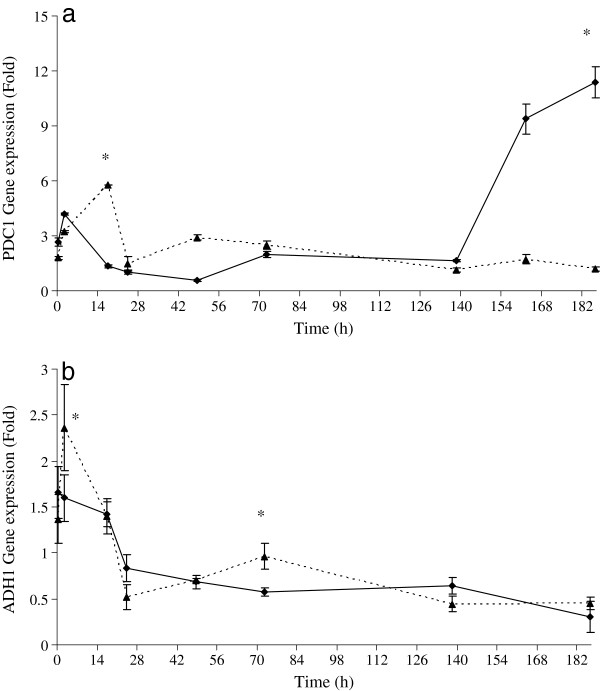
Figure 6.
Gene expression. Expression levels of PDC1 (a) and ADH1 (b) in S. cerevisiae at different stages of fermentation. Dashed lines represent mixed culture, and continuous lines, pure S. cerevisiae culture. Error bars show standard deviations, including three technical repetitions for two independent biological samples. Relative normalized fold expression is calculated using TAF10 as reference gene. Values displaying asterisk are significantly different according to the Duncan test (0.05%).

