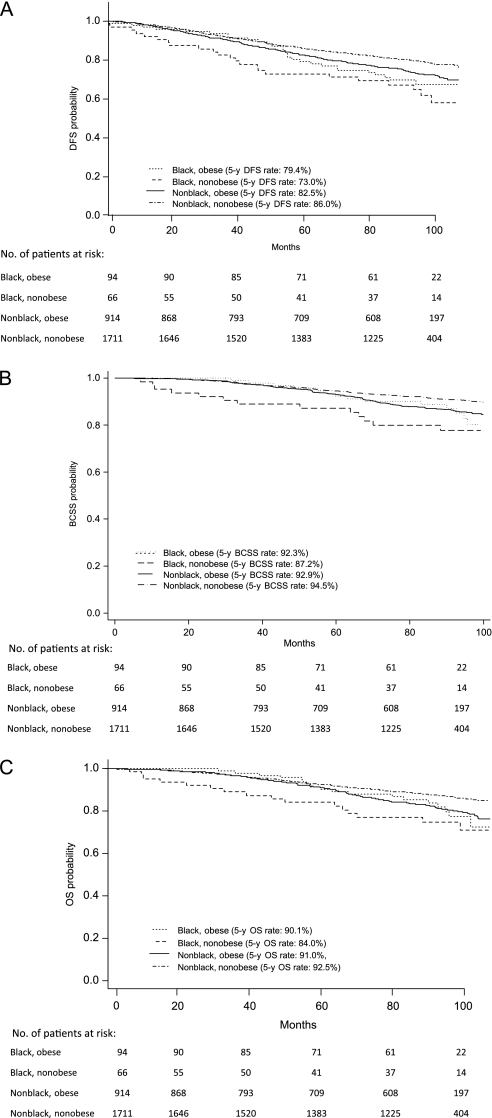
Figure 2.
Kaplan–Meier survival curves, by race and obesity, for breast cancer patients with hormone receptor–positive, HER2-negative or unknown disease. A) Disease-free survival (DFS). DFS rates at 60 months (5 years) were 79.4% (95% CI = 69.5% to 88.3%) for black obese patients, 73.0% (95% CI = 60.1% to 82.2%) for black nonobese patients, 82.5% (95% CI = 79.9% to 84.9%) for nonblack obese patients, and 86.0% (95% CI = 84.2% to 87.6%) for nonblack nonobese patients. The corresponding 100-month rates were 67.5% (95% CI = 56.0% to 76.6%), 58.1% (95% CI = 42.6% to 70.8%), 71.9% (95% CI = 68.6% to 75.0%), and 77.9% (95% CI = 75.6% to 80.0%), respectively. B) Breast cancer–specific survival (BCSS). BCSS rates at 60 months (5 years) were 92.3% (95% CI = 84.5% to 96.2%) for black obese patients, 87.2% (95% CI = 76.0% to 93.4%) for black nonobese patients, 92.9% (95% CI = 91.0% to 94.4%) for nonblack obese patients, and 94.5% (95% CI = 93.2% to 95.5%) for nonblack nonobese patients. The corresponding 100-month rates were 80.2% (95% CI = 67.8% to 88.2%), 77.6% (95% CI = 64.5% to 86.4%), 84.5% (95% CI = 81.6% to 86.9%), and 89.7% (95% CI = 87.9% to 91.2%), respectively. C) Overall survival (OS). OS rates at 60 months (5 years) were 90.1% (95% CI = 81.9% to 94.8%) for black obese patients, 84.0% (95% CI = 72.4% to 91.1%) for black nonobese patients, 91.0% (95% CI = 88.9% to 92.7%) for nonblack obese patients, and 92.5% (95% CI = 91.2% to 93.7%) for nonblack nonobese patients. The corresponding 100-month rates were 77.3% (95% CI = 65.1% to 85.7%), 71.1% (95% CI = 56.1% to 81.8%), 79.2% (95% CI = 76.1% to 82.0%), and 85.5% (95% CI = 83.9% to 87.6%), respectively. CI = confidence interval; HR = hazard ratio.

