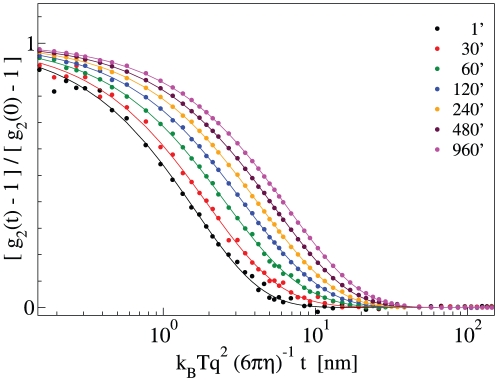
Figure 1. Intensity autocorrelation function g2(t) of a 8.5 µM NS solution during polymerization at 45°C at selected times, as shown in the legend (coloured circles), and the relative fit by exponential funtions (solid curve).
The time axis is renormalized by the following thernodynamic and experimental quantities: q is the scattering vector, T the temperature, kB the Boltzmann constant, and η the solvent viscosity.

