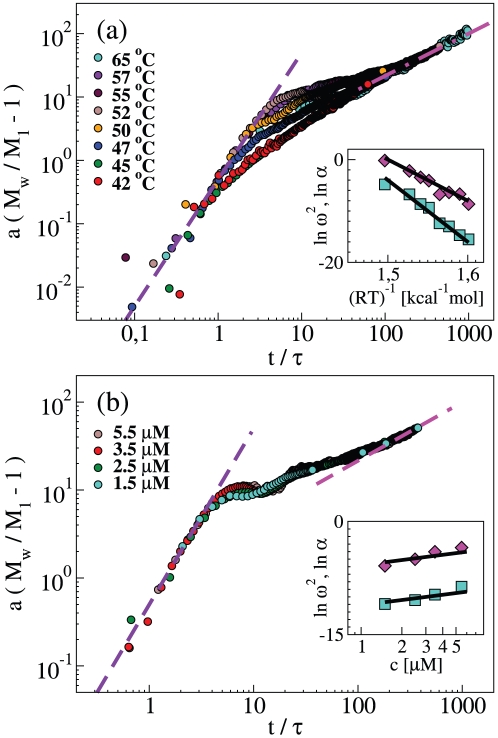
Figure 7. Kinetics of neuroserpin polymerization at different temperatures (panel a) and concentrations (panel b).
Weight average mass from figs. 3a and 4a, respectively, rescaled as explained in the main text. Insets: Kinetics rates obtained from the scaling parameters ω2 (squares) and α (diamonds).

