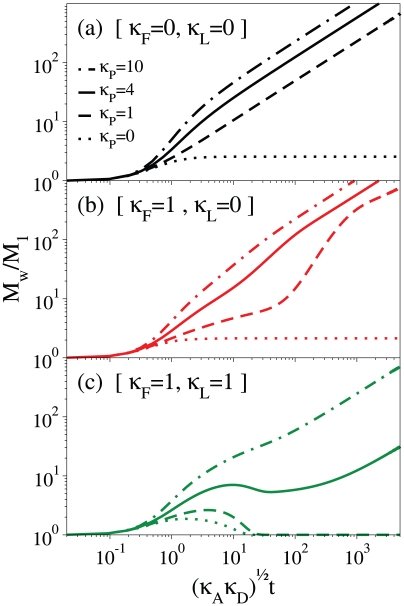
Figure 8. Polymerization kinetics due to different processes.
The y-axis displays the weight average mass, the x-axis displays the time normalized by using the rates of activation (κA) and dimerization (κD). (a) Kinetics at different rates of polymer-polymer association (κP). (b) Kinetics as in the previous panel by addition of a fragmentation process from polymers below 31 units. (c) Kinetics as in the previous panel by addition of a latentization process from activated monomers.

