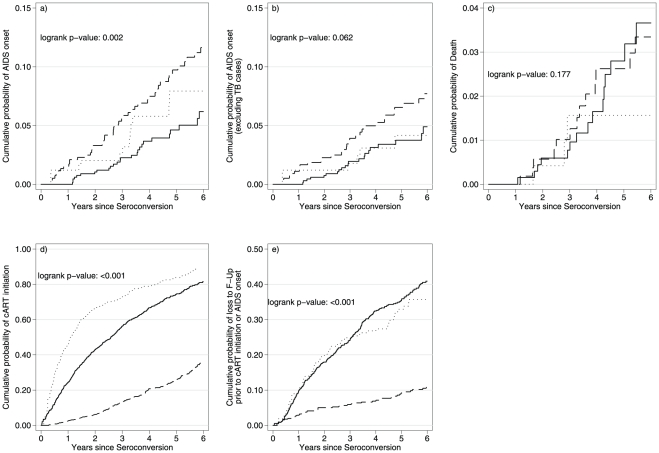
Figure 2. Kaplan-Meier curves of the cumulative probability of a) clinical AIDS, b) clinical AIDS (excluding TB cases) c) Death, d) cART initiation and e) loss to follow-up (≥12 months) before cART initiation or AIDS onset.
Curves shown by study group: individuals of non-African origin (solid line) or of African origin (dotted line) in European cohorts and individuals in SSA cohorts (dashed line).

