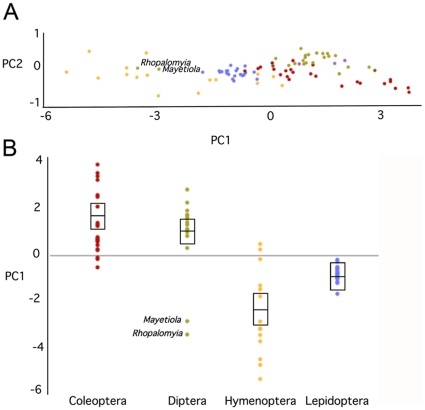
Figure 5. Principal components analysis of base frequencies among mitochondrial genome sequences.
A Plot of the first principal component against the second principal component (explaining 93% and 5% of the variability, respectively). B Boxplot of PC1 according to insect orders. An ANOVA of the first principal component shows that the base composition in Hymenoptera is significantly biased relative to the other orders (P<0.01 for all pairwise comparisons involving Hymenoptera), due to very high AT frequencies. Samples are color-coded based on order-level taxonomic affiliations (see Fig. 2).

