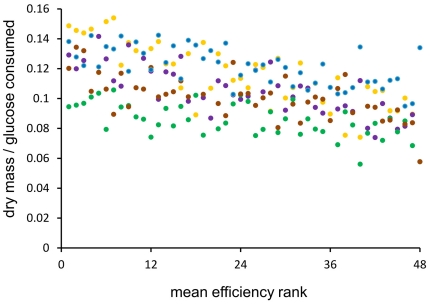
Figure 1. Metabolic efficiency in different environments.
A sample of single deletion strains was assayed for dry mass and glucose consumption. The strains were ranked within a single environment and then a mean rank was calculated. Data points are shown for: YPD (blue), 37°C (yellow), caffeine (violet), sodium chloride (brown), and minimal SD medium (green).

