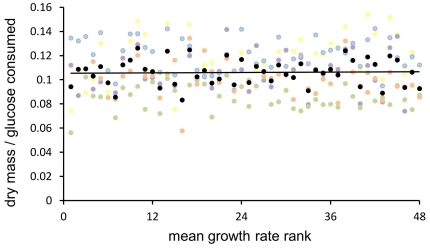
Figure 4. Metabolic efficiency and the rate of growth in five environments.
The maximum growth rate was measured for the sample of 48 strains and used to rank strains within each environment. Black points represent growth ranks averaged over 5 environments, with a regression line with a slope of 0.00005 which is statistically indistinguishable from being flat (t = 0.221, df = 46, P = 0.826).

