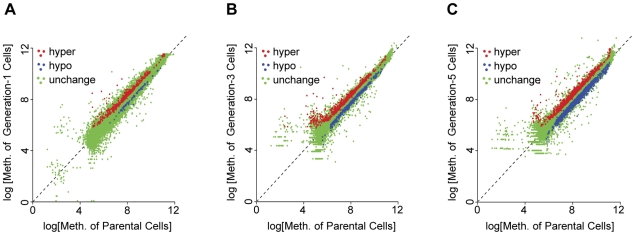
Figure 1. Scatter plots of differential DNA methylation for A2780 cells after 1, 3, and 5 cell generations, coincident with cisplatin DNA crosslinking.
The log signals of average observed methylation signals of the parent A2780 cells (x-axis) were compared to the log signals of observed methylation in (A) generation-1; (B) generation-3, and (C) generation-5 cells, respectively. Red represents the hyper methylated CGI probe loci, blue represents the hypo methylated CGI probe loci, and green represents not differentially methylated CGI probe loci.

