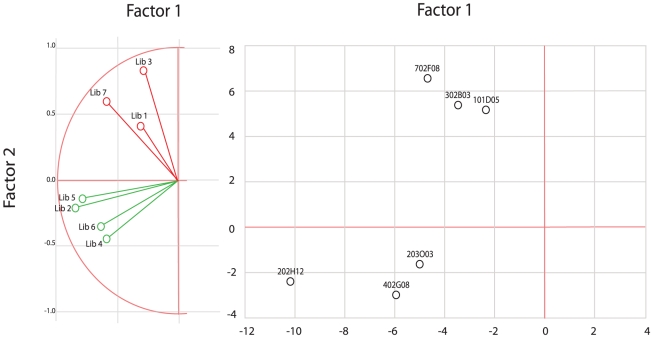
Figure 2. Plot of the libraries and the most discriminant bacterial species by principal component analysis.
A: Libraries from healthy and diseased sites are colored green and red, respectively. B: Bacterial species or phylotypes are color-coded according to their weight in healthy (green) and diseased (red) libraries.

