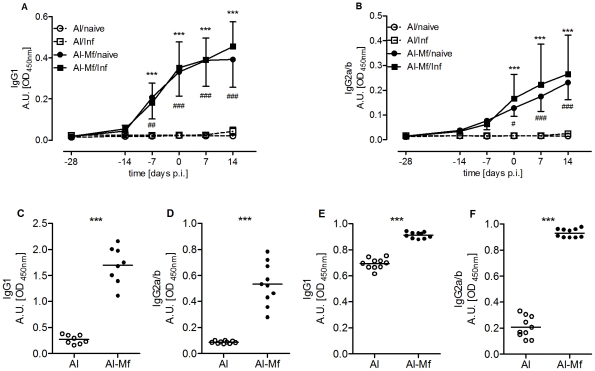
Figure 5. Immunization induces Mf-specific IgG1 and IgG2.
Mice were immunized three times s.c. with 100,000 Mf in alum (Al-Mf/naïve, Al-Mf/Inf). Control mice received alum alone (Al/naïve, Al/Inf). L. sigmodontis challenge infection was performed one week after the last immunization (Al/Inf, Al-Mf/Inf) or left uninfected (Al/naïve, Al-Mf/naïve). Plasma levels of Mf-specific IgG1 (A) and IgG2a/b (B) were measured. Two-way ANOVA was used for statistical analysis, day 0 indicates day of challenge infection. Asterisks indicate significant differences between the immunized and infected, and the corresponding control group (*** P<0.001) and pound signs between the immunized but uninfected, and the corresponding control group (# P<0.05, ## P<0.01, ### P<0.001). (C–F) Pleural space lavage was analyzed for specific IgG1 and IgG2a/b on days 22 (C, D) and 70 p.i. (E, F). Data analyzed with Welch-corrected t-test (mean, *** P<0.001). Graphs show representatives of three independent experiments with eight to ten mice each group (additional experiments see Figure S6A, B, E–J).

