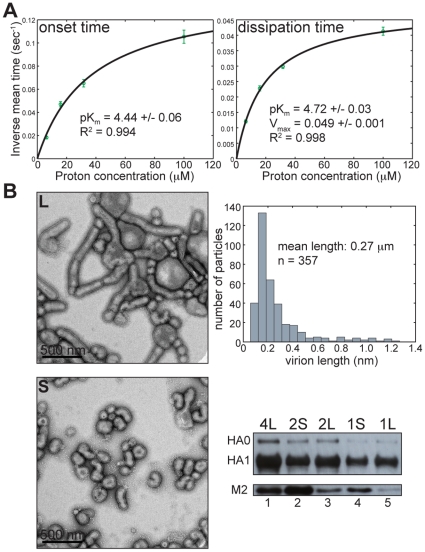
Figure 4. Kinetics of internal virion acidification.
A) Proton-concentration dependence of inverse onset (left) and dissipation times (right). Error bars are propagated from the standard error of the mean (SEM) of measured onset and dissipation times as SEM(mean time)/(mean time)2. B) Number of M2 channels per virion does not scale with virion size. Upper and lower left – representative negative-stain electron micrographs of long (L) and short (S) virion fractions. All kinetic measurements in Figures 1 to 4 used the long-virion fraction. Upper right – long-virion length histogram distribution as estimated from multiple negative stain electron micrographs (see Materials and Methods). Lower right – SDS-PAGE of two-fold serial dilutions of long (4L, 2L, 1L) and short (2S, 1S) virion fractions and immunoblotting using anti-HA1 antibody (upper panel, HA0 and HA1) or anti-M2 antibody (lower panel, M2).

