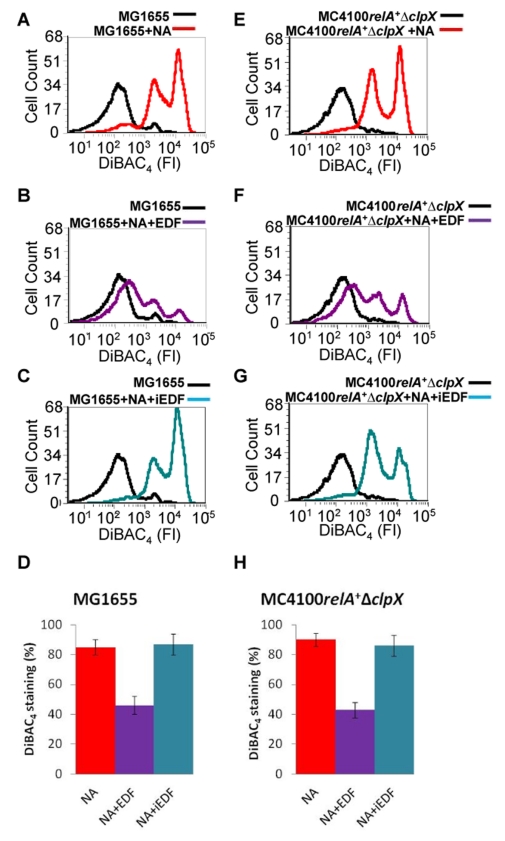
Figure 5. The effect of EDF on membrane depolarization.
After the various E. coli strains were grown to OD600 0.6, the cells were treated as follows: (A) MG1655+100 µg/ml NA; (B) MG1655+100 µg/ml NA+50 ng/ml EDF; (C) MG1655+100 µg/ml NA+50 ng/ml iEDF (NNGNN); (E) MC4100relA +ΔclpX+100 µg/ml NA; (F) MC4100relA +ΔclpX+100 µg/ml NA+200 ng/ml EDF; (G) MC4100relA +ΔclpX+100 µg/ml NA+200 ng/ml iEDF. The quantitative effect of NA and NA+EDF on the percent of DiBAC4-stained cells is shown in (D) (data from [A–C]) and (H) (data from [E–G]). Error bars in (D) and (H) indicate standard deviation. Staining, FACS analysis, and determining the fraction of the DiBAC4-stained (membrane depolarized) cells were carried out as described in the legend to Figure 1. All data are representative of three independent experiments. FI, fluorescence intensity.

